Solar cleaning buyers often ask one question: « How much more power will we get after cleaning? »
The honest answer is: measure it.
A drone cleaning demo can look impressive on video, but photos do not prove energy gain. PV O&M teams should compare cleaned and uncleaned sections using production data, site conditions and a simple A/B test.
Quick answer: select comparable PV blocks, clean one block, leave the other as a control, record kWh/kWp before and after cleaning, and compare results under similar irradiance and temperature conditions. For stronger analysis, use irradiance sensors, performance ratio or soiling measurements.
Who This Guide Is For
This guide is for:
- PV O&M companies
- Solar asset owners
- EPCs
- Drone cleaning service providers
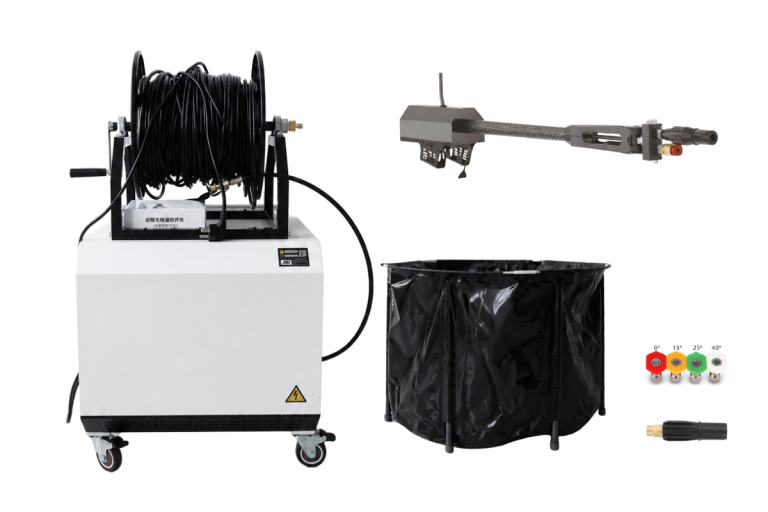
- Buyers testing the T100 Solar Cleaning Kit or Solaris C60V
- Sales teams that need evidence before quoting long-term cleaning contracts
Why kWh/kWp Is Useful
kWh/kWp normalizes energy production by installed DC capacity. It helps compare two PV blocks of different sizes.
Example:
- Block A produces 4,200 kWh from 1,000 kWp.
- Block A output = 4.2 kWh/kWp.
- Block B produces 2,050 kWh from 500 kWp.
- Block B output = 4.1 kWh/kWp.
This is still not perfect because irradiance, temperature, inverter clipping, shading and downtime also matter. But it is a useful practical starting point.
Basic A/B Cleaning Test Design
| Step | Action |
|---|---|
| 1 | Select two similar PV blocks |
| 2 | Record baseline production for several days |
| 3 | Clean Block A and leave Block B uncleaned |
| 4 | Record production after cleaning |
| 5 | Compare kWh/kWp change |
| 6 | Review weather, irradiance, downtime and soiling notes |
| 7 | Decide whether cleaning schedule is economically justified |
Choose Comparable Test Blocks
Select blocks with similar:
- Module type
- Tilt and azimuth
- String/inverter configuration
- Shading exposure
- Soiling level
- Irradiance exposure
- O&M condition
Avoid comparing a clean, shaded rooftop to a dusty, unshaded ground-mount block. The test will be misleading.
What Data to Collect
Minimum data:
- Daily kWh by inverter or block
- Installed DC capacity in kWp
- Cleaning date and time
- Weather notes
- Soiling photos
- Downtime or fault notes
Better data:
- Plane-of-array irradiance
- Module temperature
- Ambient temperature
- Soiling sensor data
- Performance ratio
- Inverter alarms
- Water quality and cleaning method
NREL’s PV performance evaluation guidance emphasizes defining the test boundary, collecting accurate uninterrupted data and documenting the procedure so results can be interpreted correctly.
Simple Calculation
For each block:
Daily normalized output = daily kWh / installed kWp
Then compare:
Post-cleaning improvement = cleaned block kWh/kWp change – control block kWh/kWp change
Example:
- Cleaned block baseline: 4.0 kWh/kWp
- Cleaned block after cleaning: 4.4 kWh/kWp
- Control block baseline: 4.0 kWh/kWp
- Control block after same period: 4.1 kWh/kWp
- Estimated cleaning effect: (4.4 – 4.0) – (4.1 – 4.0) = 0.3 kWh/kWp
Common Mistakes
| Mistake | Better Practice |
|---|---|
| Using photos only | Use photos plus production data |
| Comparing different weather days without context | Use a control block or irradiance normalization |
| Cleaning the worst area and comparing it to the best area | Choose similar blocks |
| Ignoring inverter faults | Remove fault periods or document them |
| Claiming ROI from one short demo | Run repeated tests across soiling seasons |
How Drone Cleaning Fits the Test
A drone cleaning test should document:
- Product used: T100 kit, Solaris C60V or other method
- Water type
- Nozzle layout
- Spray distance
- Cleaning time
- Number of flights
- Water used
- Crew size
- Area cleaned
- Any manual follow-up
This turns a video demo into an O&M data point.
FAQ
Is kWh/kWp enough to prove cleaning ROI?
It is a good practical starting point, but stronger analysis should include irradiance, temperature, downtime and soiling context.
How many days should I measure?
Use enough days to reduce weather noise. A single day can be misleading. The exact period depends on site data quality and weather stability.
Can I compare before and after only?
You can, but A/B with a control block is better because it helps separate cleaning effect from weather change.
What if the site has tracking systems?
Use comparable tracker blocks and make sure tracking faults or stow events are documented.
Can drone cleaning remove all soiling?
No. Effect depends on soiling type, water quality, nozzle setup, spray distance and surface condition.
Should I use DI water for the test?
Use water quality that matches the planned routine operation. If residue risk is important, test RO/DI water.
How should I report results to a customer?
Report method, test blocks, dates, weather, kWh/kWp before/after, limitations and next-step recommendation.
Can EAUAV help plan a test?
EAUAV can help buyers define product configuration and cleaning workflow, but the owner or O&M team should manage site data and final performance analysis.
Official Source for Further Reading
- NREL PV Performance Modeling Collaborative: https://pvpmc.sandia.gov/
- NREL soiling research overview: https://www.nrel.gov/pv/soiling.html
Conclusion
A good solar cleaning demo should produce more than video. It should produce a repeatable test method.
Use A/B kWh/kWp comparison to decide whether drone cleaning is technically and economically justified for your site.